
Creating lots of content (even quality content) isn’t always the smartest decision.
Sometimes, it’s much more effective to audit your existing content than creating new content from scratch and guessing it will do wonders for your business.
The idea is pretty simple.
You already have content that brings traffic, leads, and even sales. Then, why not double down your effort on what’s already working and eliminate what’s not working?
Still not sure whether you should perform an audit or not?
Then ask these questions to yourself:
- What type of content drives me the most amount of traffic but the least amount of leads?
- Is user engagement on my site getting better over time?
- Is there any lack of content based on the customer journey?
- Does my site have articles that need to be updated, edited, or even deleted?
- What is the average number of touchpoints of visitors for getting a sale/lead?
- Which of the webpages is adding friction in goal conversion?
- And So on…
If you don’t have clear answers to these questions (at least), you’re missing out on a huge opportunity to maximize your content effort.
In fact, 96% of marketing decision-makers say content marketing has been effective for their brand (Zazzle Media, 2019)
But to maximize your content marketing effectiveness, you must perform an audit at least twice a year. And this is what you’re going to learn today.
In this guide, I’ll share key elements of performing an audit, how to measure the effectiveness of your campaign, and an actionable checklist that you can start using right away.
Let’s get going.
Download your Free template to develop your winning content marketing strategy in record time. Plus, get a PDF version of this 4000+ words value post.
Difference between a brand that performs a content marketing audit and the one that doesn’t?

“Creating a content strategy without running periodic content audits is like shooting arrows in the dark. You don’t really know where you stand, where you need to improve, what are your strengths & weaknesses, and where your next growth phase will come from. A content audit shows you the best-performing pages, keywords, and content for your brand. It helps you identify content gaps that can improve your buyer’s journey and drive growth.
And, most importantly, it gives you direction and helps you devise strategies based on solid data trends. So the next time you sit with your team to brainstorm content ideas, consider running an audit first so that you know where to spend your valuable time and resources.”
– Contributed by Jawad Khan (Content Marketing Consultant)
One of the first mistakes I find in most of the articles available is treating content marketing audit as same as:
- Site audit, or
- SEO audit
Even though both of these take a huge portion of the entire auditing process, you still have a lot to cover in terms of content effectiveness.
In simple words, a content marketing audit is a way of identifying:
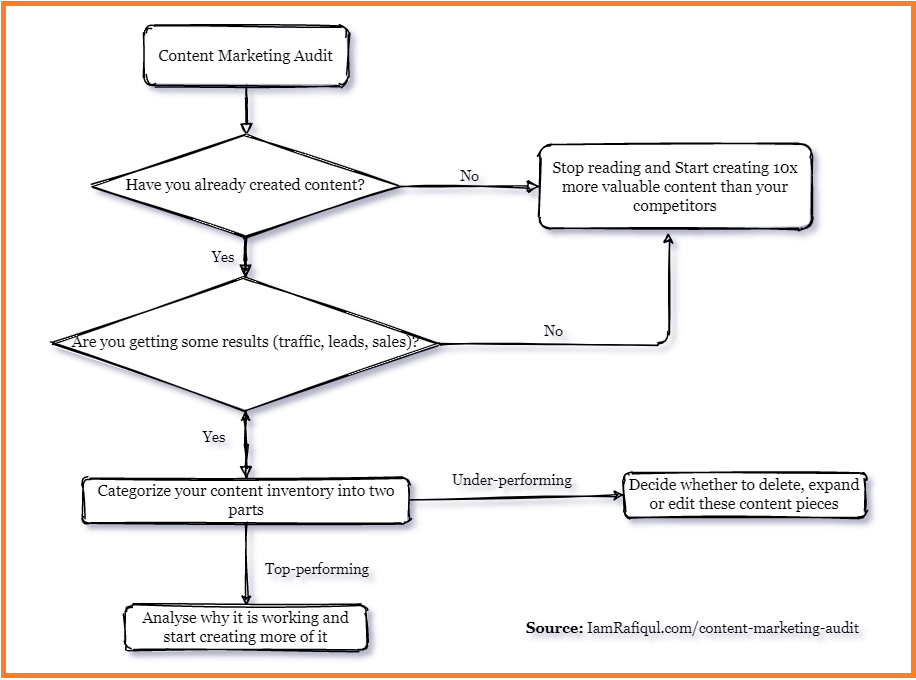
- What’s working and why (So you can create more similar pieces of content that’s already giving you the maximum reach/engagement/conversion).
- Under-performing content pieces and deciding which one to delete, edit, or upgrade.
1. Aligning your business goals
The first step is always to align your business goals with the content audit.
Remember, when it comes to content marketing, the term ‘audit’ is too broad to consider. And that is why you need to narrow down your requirement based on what metrics/numbers you/your client want to achieve.
Here are two examples to understand why this step is necessary.
Example 1:
Consider your goal was to increase search traffic to 5000 visitors/month in one year to your new website.
Now imagine in the mid-year, you’re performing the audit.
In this case, your focus is to build search traffic, so you’ll look for the articles that are providing you the most and least number of traffic.
Also, you may look for the targeted keywords to understand whether you’ve targeted the best possible keywords or not.
You may also look into the percentage of traffic coming from different sources like Facebook groups, email marketing, and YouTube. So, you can focus more on the channels that are giving you the best results.
Overall, your entire audit process will revolve around search traffic (your business goals)
Let’s look for another example.
Example 2:
Imagine your goal was to generate at least 1500 email subscribers by the end of the year.
In this case, your auditing process may focus mostly on the followings:
- Which campaigns (Giveaway, content upgrades, newsletter page, exit pop-ups, etc.) are giving you the highest conversion rate?
- Identifying content pieces with low CTR? (So maybe you can change the CTAs, or edit the content)
- Which traffic sources are giving you maximum conversion rate? (That may help you hit your target goals of email subscribers within the timeline)
What’s the point?
It is your business goals that direct your auditing process. So, make sure you start prioritizing your target even before you dive into technical auditing.
Even if you don’t have any clear business goals to achieve yet, I would suggest you have one clear goal.
Yes, only one specific goal.
Most probably, your business goal will be among the followings:
- Traffic
- Engagement
- Conversion
- Retention
Now, what if your business goal (say 1500 email subscribers in one year) is clear to you, but not sure about your first focus (Say traffic or conversion or engagement).
Let me cite an example.
Imagine your team has already set business goals, and that is to add 1500 email subscribers in the next year.
Now, after six months, you’re not sure about whether you should focus on getting more traffic or improving the conversion rate.
In this scenario, reverse engineering is a fast way of understanding your first focus.
Consider the following metrics:
Business goal: 1500 email subscribers in the next one-year time-frame
Monthly visitors: 2000 (current state)
Conversion rate: 3 % (Your current average conversion rate)
Maximum conversion rate: 5% (hypothesis based on industry standards)
[Note: if you don’t have enough data for the conversion rate, then consider a hypothesis based on your industry standards]
These data will now give you a better understanding of your first focus. Here’s how.
Current state:
Monthly newsletter signups = 2000 * (3/100) = 60 (considering conversion rate 3%)
Therefore, total number of signups in 12 months = 60 * 12 = 720 < 1500 (business goal)
This shows that with the current conversion rate and traffic, the business goal is unattainable.
So, we’ll test these values again, but this time with the maximum conversion rate (based on industry standards).
Hypothesized:
Monthly newsletter signups = 2000 * (5/100) = 100 (considering conversion rate 5%)
Therefore, total number of signups in 12 months = 100 * 12 = 1200 < 1500 (business goal)
So, even with the maximum conversion rate, the goal is unattainable.
That means we should definitely focus more on increasing the search traffic.
Even though this is just to identify your first focus in the auditing process, you can even calculate the approximately monthly visitors you should target.
Considering the maximum conversion rate (5%), minimum visitors should be:
Target monthly visitors = {(goal for newsletter signups)/(number of months)} * 100/(maximum conversion rate in %)
Target monthly visitors = {(1500/12) * (100/5)} = 2500
By increasing the monthly visitors from 2000 to 2500, business goals can be achieved.
So, the first focus here is to increase search traffic.
And this is what you should also do to get to know your first focus.
Now, I want you to get a pen and paper and figure out your first focus now.
Once you’re done, move on to the next stage.
Read content marketing jobs report
2. Reach, Engagement, and Conversion
The three most common content marketing objectives are:
- Reach
- Engagement
- Conversion
In this guide, I’ll discuss the metrics you should consider and the actionable tips to measure them.
[Note: depending upon your first focus/objectives, you may not need to address each of these metrics. But to find the improvement scope for each part of your content marketing funnel, you may refer to the following steps]
Let’s start with one by one.
Reach
It’s always better to start with categorizing the different sources of reach.
For example, SEO, social media, email marketing, podcast, YouTube could be your possible source of reaching out to existing and new audiences.
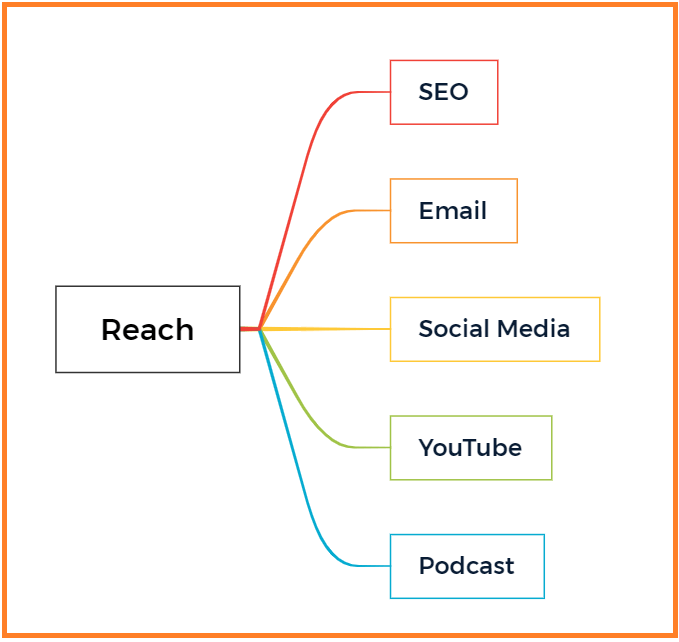
Let’s dive into each of these.
Measuring underperforming content
An easy and effective way to assess reach through SEO is by finding the under-performing pages on search engines.
From your Google Analytics account, you’ll get to see the pages that are ranking on second or third pages on google.
(Make sure your google analytics is connected with google search console)
And even better if those pages are ranking on the second or third pages for the high search volume keywords.
Here’s how you can implement this.
Go to your google analytics account.
And then follow this path; Acquisition ➝ Search console ➝ Landing pages.
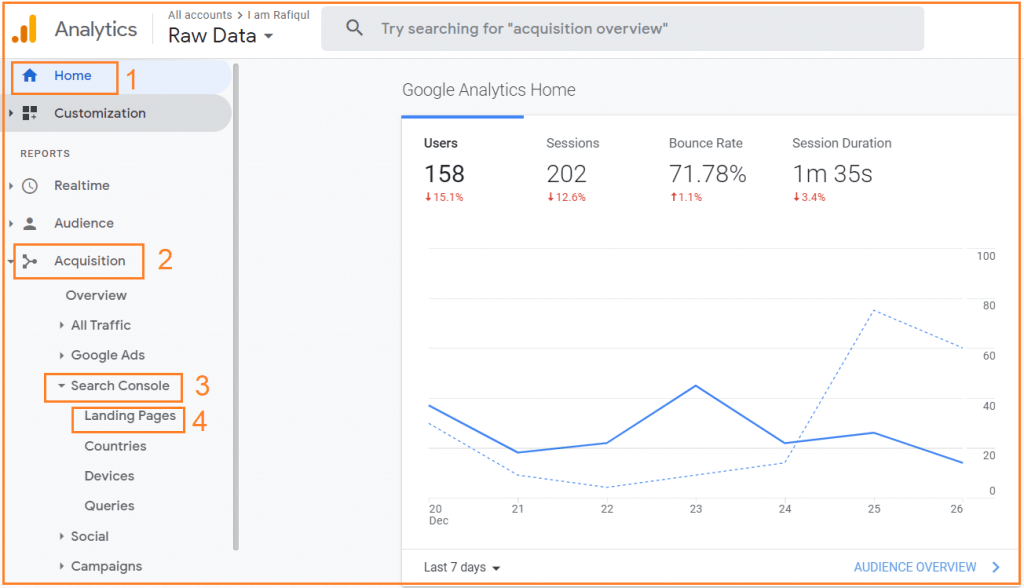
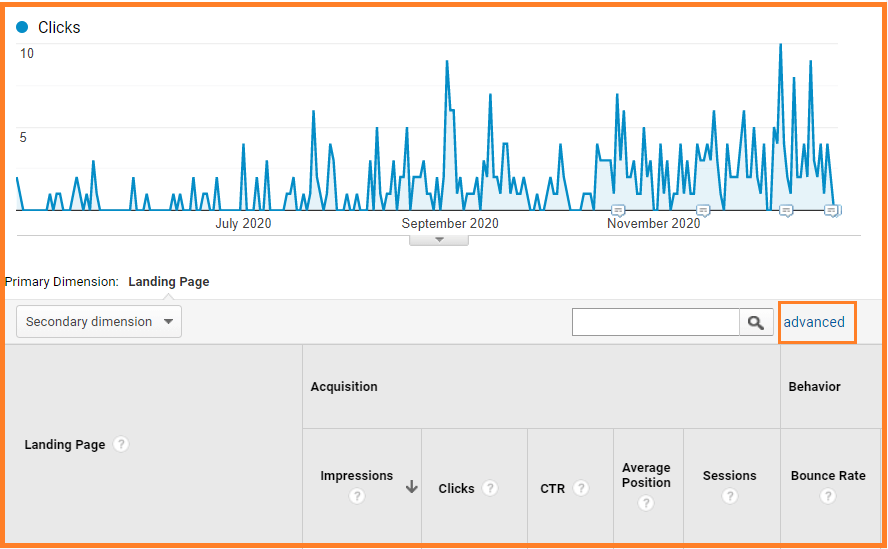
Now, you’ll get to see your web pages that are already getting some search visibility from Google.
Make sure you set the date range long enough to get sufficient data.
This is what you’ll see in the dashboard now.
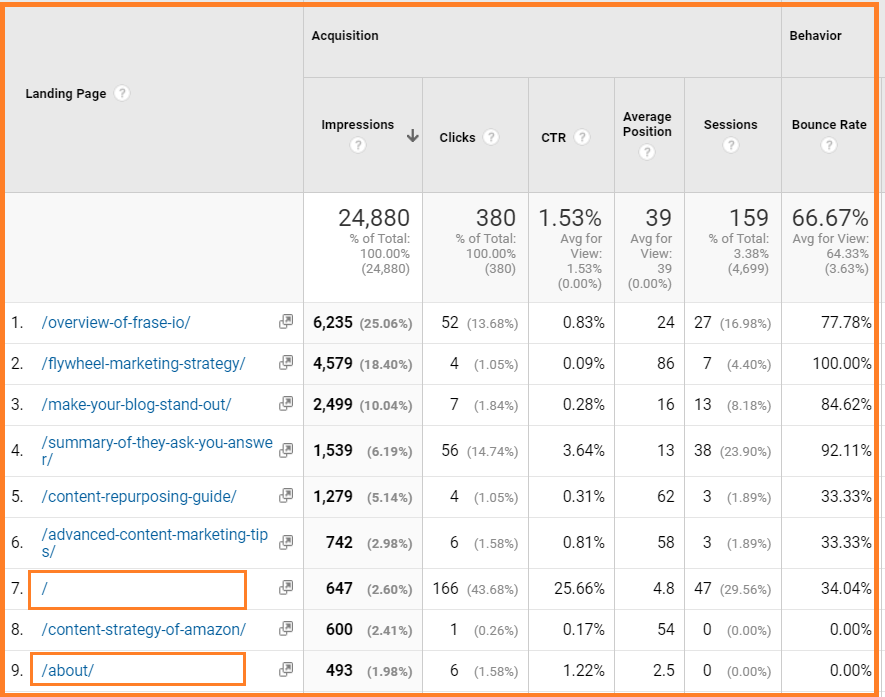
Since we’re only tracking the under-performing blog posts, we can even filter out some unnecessary pages such as the home page, about page, etc.
To do this, you need to click on ‘advanced’ text.
Next, add filters using “exclude” and “exact match” to get results only for blog posts.
For example, I’ve excluded the about(/about), blog (/blog), and the home page (/).
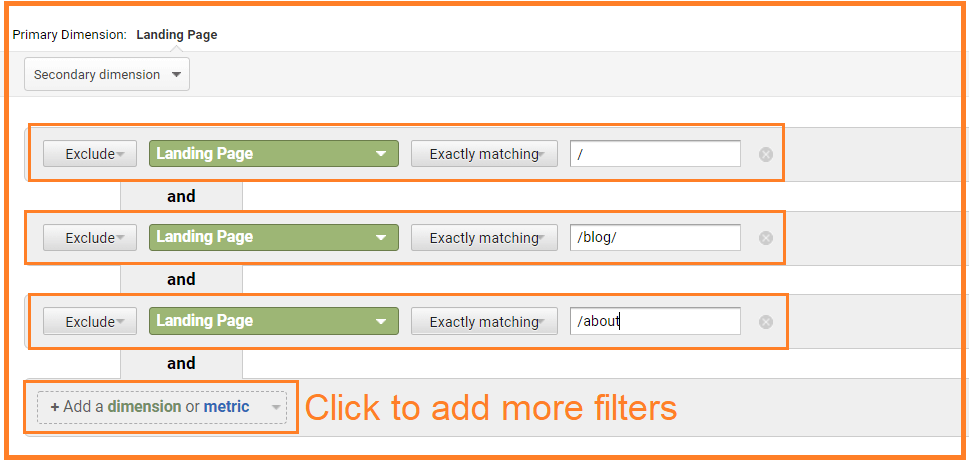
This is one way of getting a list of URLs ranking on the second or third pages for specific keywords.
You can also use Ahrefs webmaster tools (free to use) for a more accurate and comprehensive report.
From the dashboard, you can look for the section of the top page on the left-hand side.
And that will show you all of your top pages.
To make this even easier, you just need to filter the results by getting a list of URLs that are ranking from 11th to 30th (2nd to 3rd page) position on Google.
Here’s how it looks like:
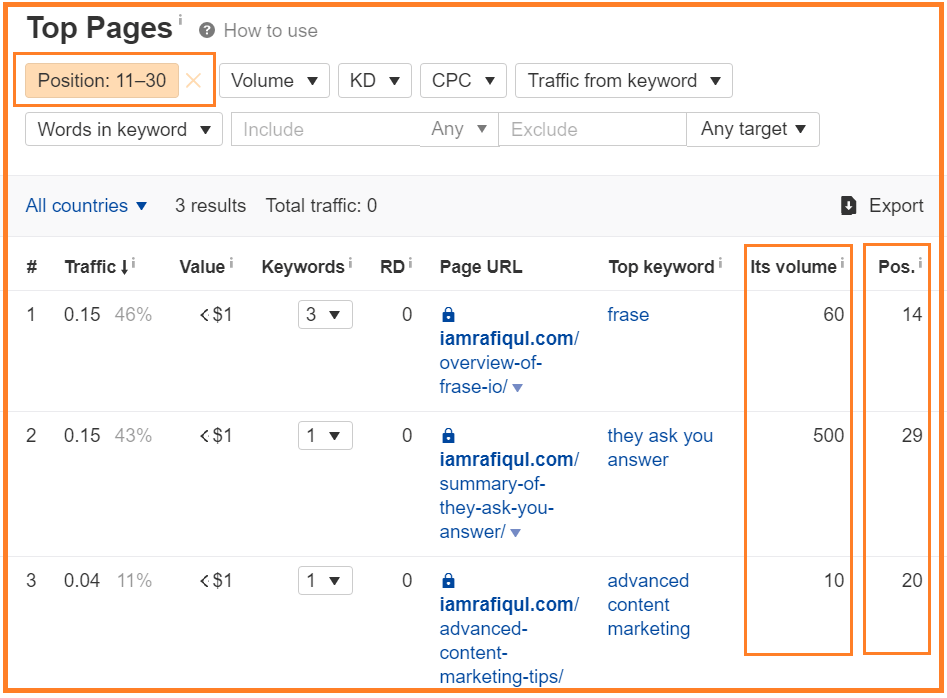
As of now, you’ve got a list of pages that you may consider updating with the latest trends or expand the overall content.
Now, the question is, should I update each of my blog posts that are ranking on either or 3rd page?
Well, the answer is no.
Well, it takes time and effort to update your old content. So, why not choose ones that may give you good results (traffic) in return.
To narrow down your list, you need to consider the following factors:
- Search volume
- Link profile
- Relevancy
Search volume (including all sources of traffic):
Here’s the key tip: never set a fixed search volume to narrow down your list. Even if a transactional ranking search term with a monthly volume of 100 is still worth updating the old content.
[Transactional keywords: These queries tend to get higher conversion rates as the user has a buying intent. Example search term: “enroll in marketing courses”]
So, keep in mind when you’re looking for search volume and look for the search terms’ search intent.
If the CTR of any pages is below average, you may consider optimizing your title tags.
Link profile:
There will be so many keywords in your industry that you cannot rank on the first page even if you have the best content than anyone. This happens mainly because the top-ranking pages have a much stronger link profile than yours.
Here are the SERP results for the search term ‘copywriting in marketing.’:
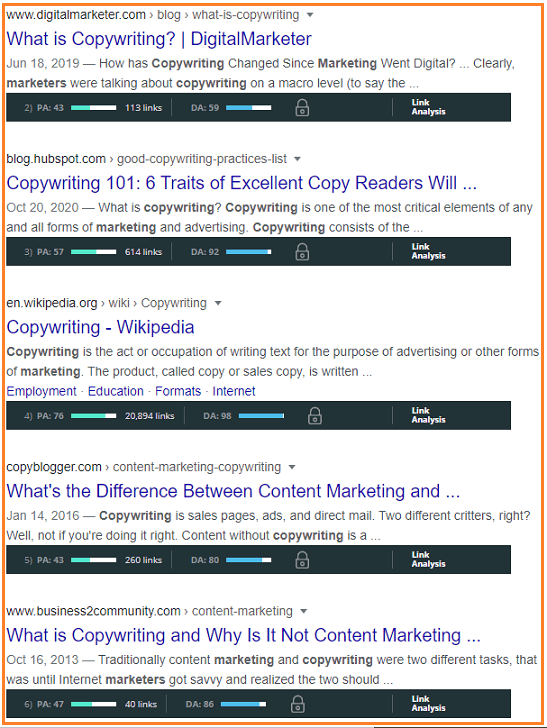
It will be extremely hard to beat these top-performing pages with high DA and PA.
Better if you can score the link profile for every search terms from 1 to 3
- Low competition
- Medium competition
- High competition
Relevancy
Also, you need to consider that some pages are written specifically for a session, event, or past years.
Here, you need to exclude those pages that don’t fit in the current state.
Download the ‘Content updating’ template to stay organized.
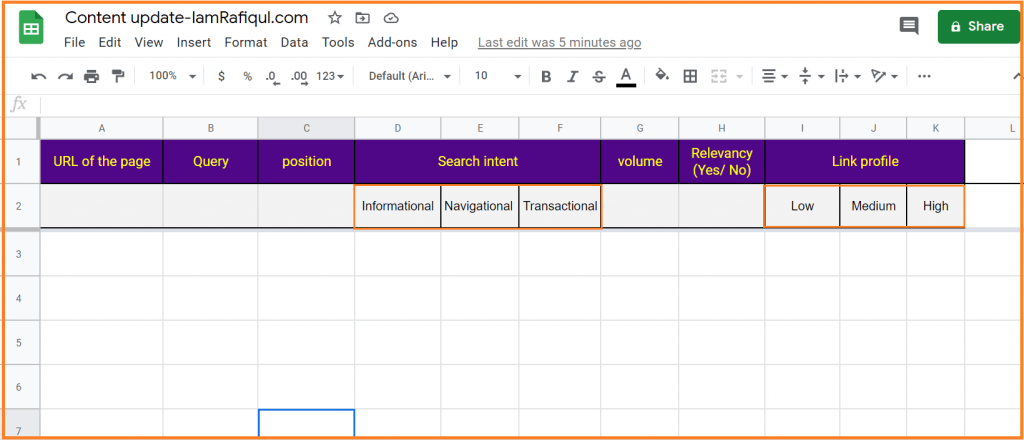
Add more points
Branded queries
Even though you rank on thousands of keywords on Google, brand queries are still the most important.
Why?
Because people who search specifically for your brand name are more likely to convert to your service or products.
You can even use the Google search console to keep an eye on your brand query trend.
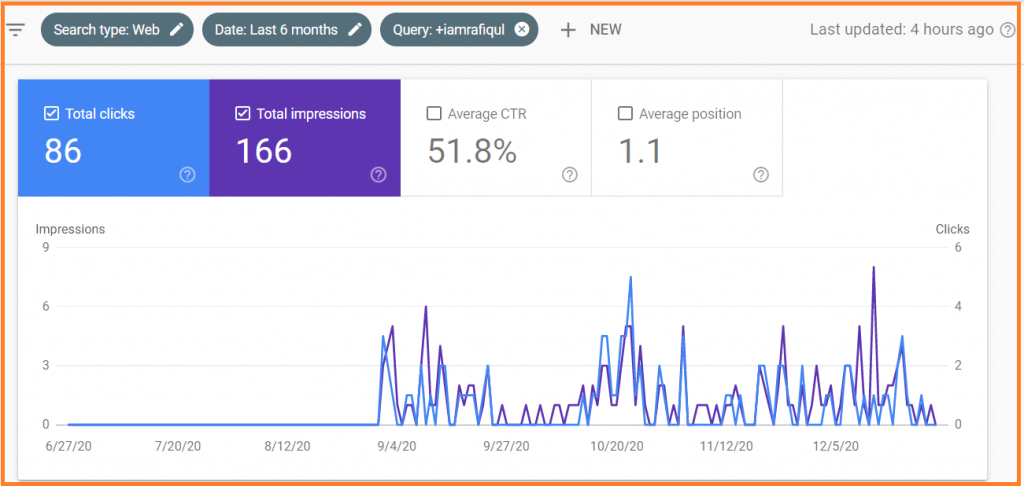
But what if your Brand SERP doesn’t look professional or trustworthy at all?
That means you’re seriously missing out on a huge part of your business.
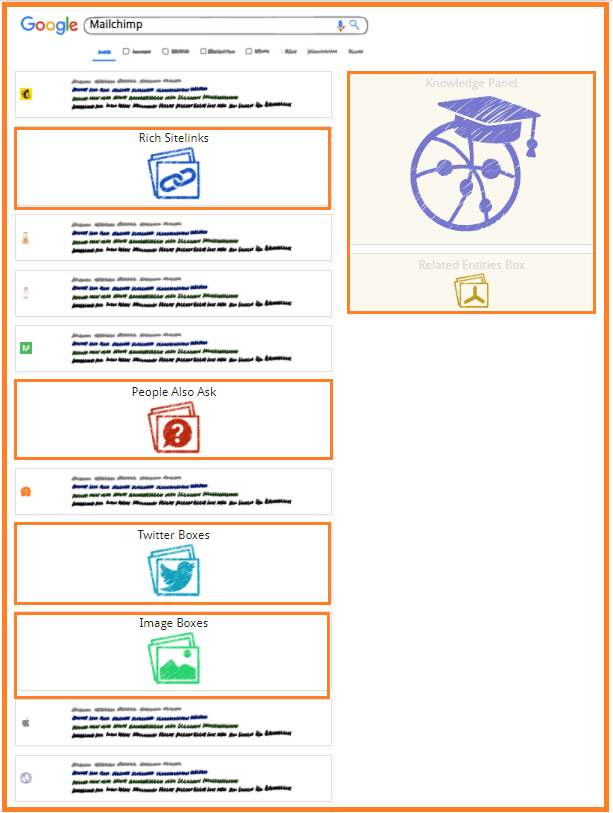
Let me show you two examples of Brand SERP, and let me know which one you feel is more impressive and trustworthy.
Example 1: SERP results for ‘MailChimp.’
Example 2: SERP result for Edge forecast
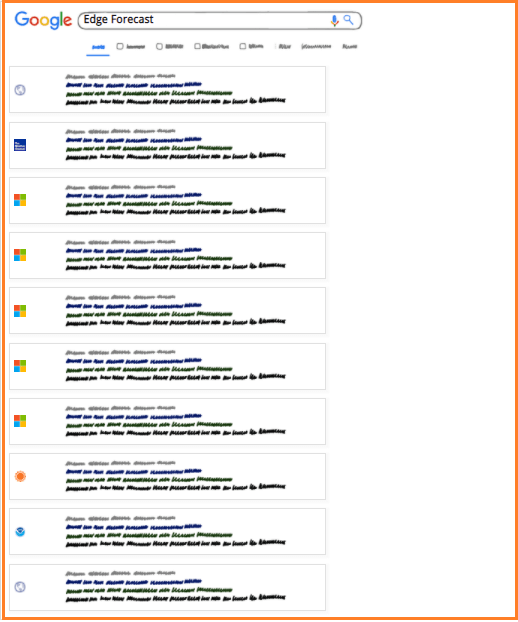
Though both represent a brand, The difference is clear.
For example, 1, you get to see a lot more information (accurate and reliable) for the brand, including site rich site links, knowledge panel, twitter box, and even ‘people may also ask’ box.
In the case of example 2, you won’t find any rich results like site links.
Now, does it really matter to count the SERP results for the content marketing audit?
First of all, the answer is Yes.
Track your Brand SERP using Kalicube Pro tool (free to use)
Secondly, it is absolutely important not only because it will help your users navigate your site better, but also because you still have some control to optimize your SERP.
Jason Barnard explains that every brand SERP should be accurate, convincing, and positive.
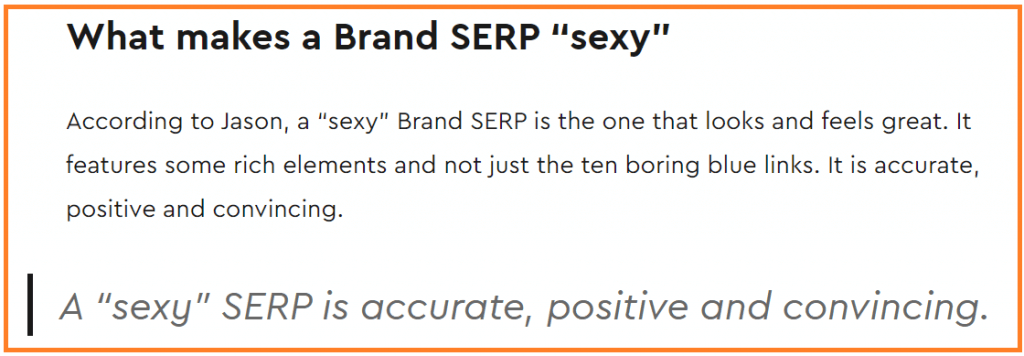
Let’s dive into how you can optimize your content to show your users accurate, positive, and convincing SERP results.
Accurate and convincing
Depending upon the site’s popularity, structure, and content, your brand SERP may differ from others.
But even if you’re just starting, you need to look for the following points.
Title and meta description:
Ensure that each of your web pages ranking on the Brand SERP shows the information you want to display to your users.
Even if you’ve added the meta description using any plugins like Yoast or Rankmath, there is a chance that Google is picking some irrelevant information for the meta description.
So, if that’s the case for you, then first check for the meta and title added by you. Next, most important, use schema markups to tell Google about your site’s information.
If you’re using WordPress CMS, you can easily add schema markups for your organization, about, contact page, etc.
Learn more about Schema implementation
Don’t let your competitors own your brand SERP.
In many cases, you’ll find competitors are ranking on the first page for the branded query. And this may directly impact your brand.
One of the obvious reasons for this is having too generic brand names or similar names with existing entities.
Here’s an example.
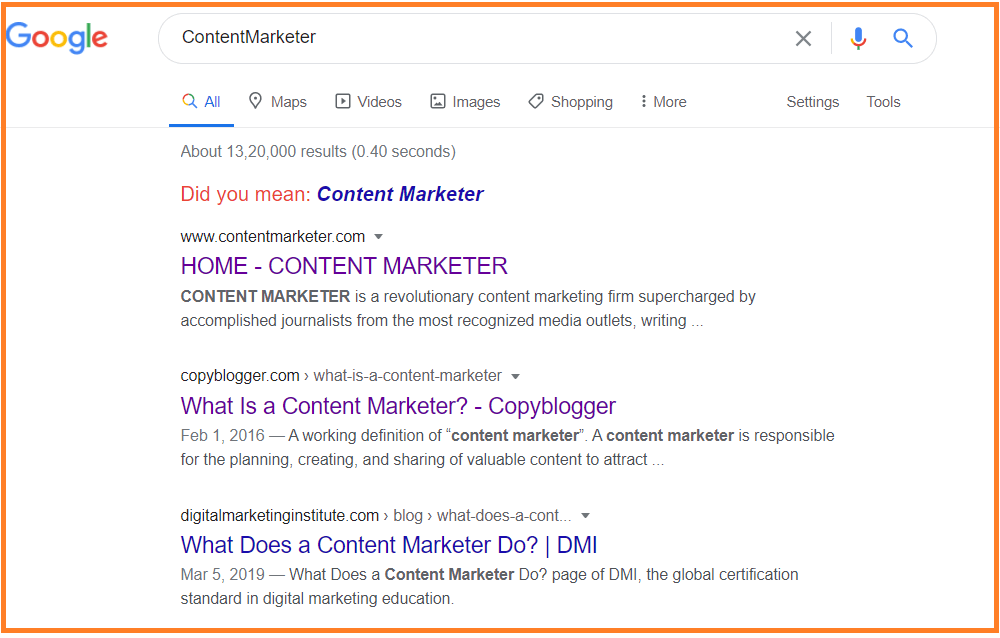
Because of the generic term, the brand name ‘content Marketer’ isn’t getting any advantage in rich results.
So if you’re also facing similar situations, the best way to improve your SER is by increasing your domain authority and getting your brand found in individual and media publishing sources like wall street journal, entrepreneur, guardian, etc.
- Is Google showing sitelinks for my brand query?
- Is your brand listed on Google My Business? If yes, then is this information up-to-date and accurate?
site links
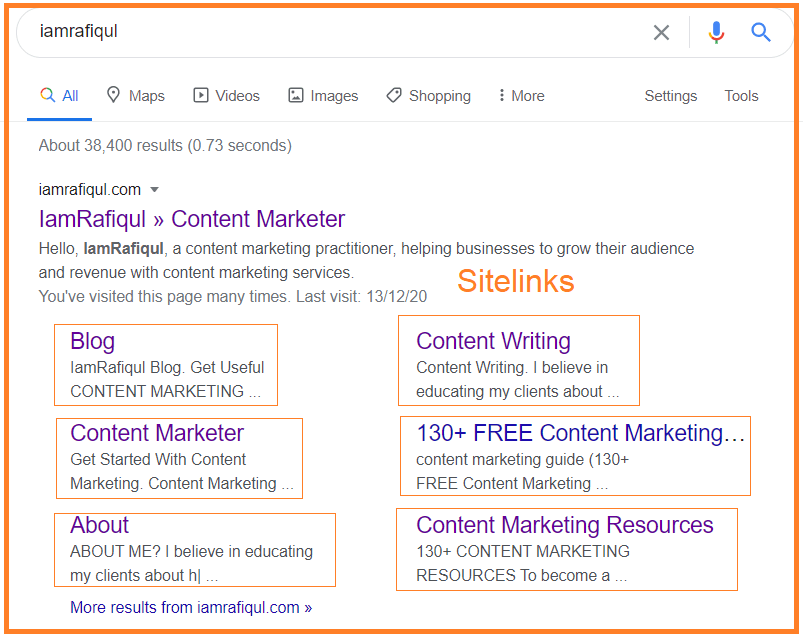
Now, no matter whether your brand is new or even unpopular, you must own the site links. 45% of the Brand SERPs have sitelinks featured, which means these sites have better control over the brand query.
First, type your brand name and see if you’re already having sitelinks for your pages or not.
Consider these points if you’re not getting sitelinks yet.
- Again make sure your site structure is clear to Google. I highly recommend you to add schema for about, contact, the home page, and even for persons (for founders, or similar designation of the brand)
- Drive traffic (even if you don’t get organic traffic, look for traffic sources like social media, email marketing- that still impacts your site links).
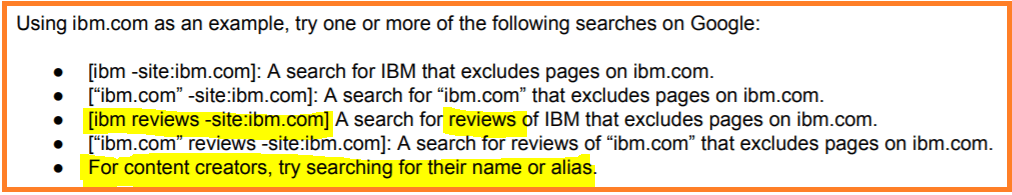
Positive
Now, this is extremely important for your brand reputation and also for SEO (E-A-T) purposes. As per Google’s quality raters guideline, raters will look for reviews of the brands (excluding the brand’s site) to measure trustworthiness.
That means reviews from third party sites are going to play a huge role in your SEO strategy.
Here’s an in-depth guide on how to improve your EAT (Expertise-authoritativeness- trustworthiness) in SEO.
This is what raters are instructed to measure brand reputation.
What should you do to improve your EAT?
First of all, integrate brand reputation within your content strategy as it is directly or indirectly related to your search rankings and user experience.
As an action plan, encourage third-party sources such as bloggers, YouTubers, journalists, authors to leave their honest reviews on your brand, product, or even services.
Next, if you’re representing a personal profile instead of a brand, consider participating in interviews, expert-roundups, events, etc.
Even only mentions your name or brand name on third-party sources (without a link back to your site) may help you build your positive reputation.
[Note: User reviews whether on Google My Business listing or in any third-party sources, the reviews’ content also matters along with the number of reviews.]
Building data-driven buyer persona
Content marketing is a customer-centric approach where your content acts as a bridge between your product and the audience.
That means your content strategy must be relevant and specific only to your relevant audience.
And to make this happen, you need an accurate buyer persona (even better, a data-driven customer profile)
Let’s explore how you can build a data-driven customer persona using Google analytics.
[Note: All of these below data is based on your site’s audience. This shows the interest, geographic information about the users who visit your site]
Step 1: getting demographic details
Go to your GA dashboard and then follow this path.
Audience → Demographics → Overview
Age and gender
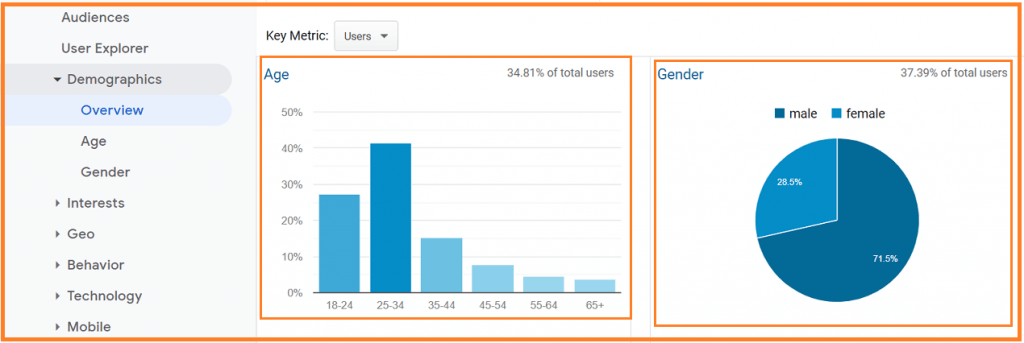
In this example, most of the audience visiting the site/blog belongs to the 18-34 age category, and 71.5% of them are male.
Step 2: Location
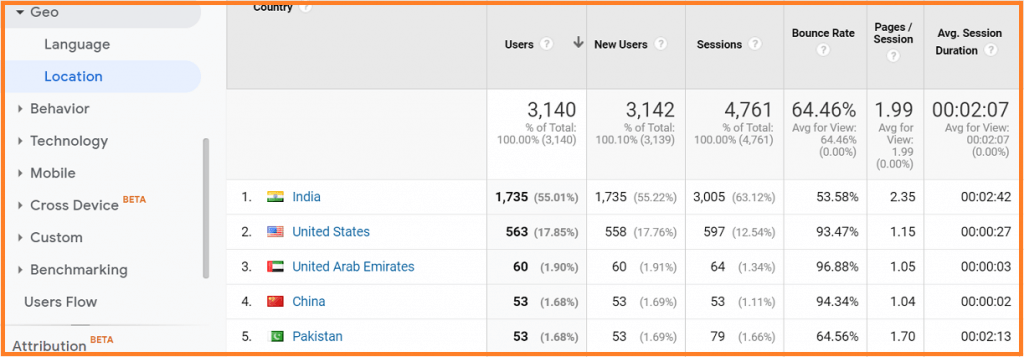
Audience → Geo → Location (By default, it will show you result based on a country level)
Here, 55% of the audience belongs to India.
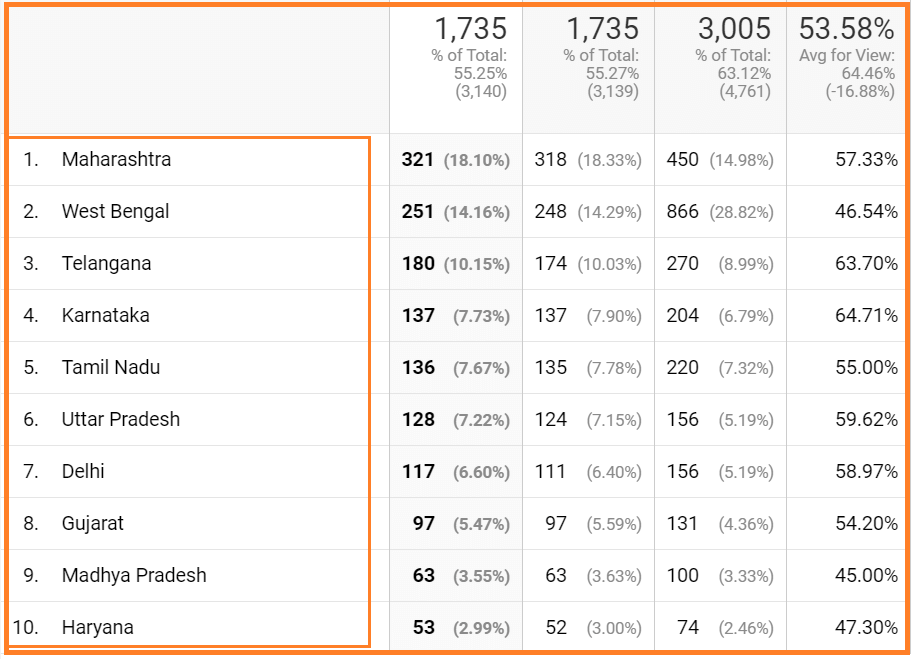
To get more specific locations under a country, just click on the country you want to see the result for.
Step 3: Finding interest
Audience → interest → overview
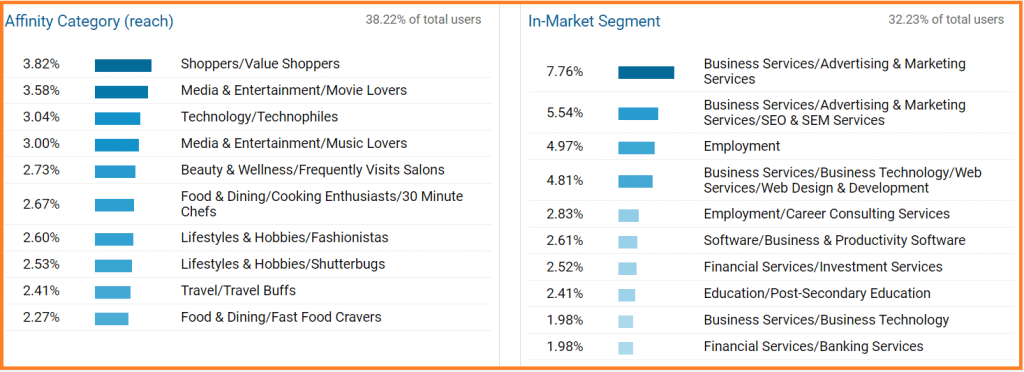
Affinity Category: This category is used as a top of the funnel audience where users in the awareness stage for the product or service
In-market segment: In-market denotes the lower of the funnel where users are in buying intent. So chances are the conversion rate for these categories will be higher as compared to the Affinity category.
Why is this data so useful?
If you’re running paid campaigns, you may consider this category or audience segmentation for better conversion.
Also, a content-focused site considers these metrics to create a more personalized experience for the users who are more likely to engage with your content on site.
So, make sure you’re aligning your audience profile (using GA) within your content marketing strategy.
By combining all of these sample data, we can make a profile something like this:
| Customer profile | Collected data using GA |
|---|---|
| Age group: | 18-34 (68%) |
| Interest (In-market segment): | Business services, advertising, marketing, SEO, and SEM services. |
| Interest (Affinity category): | Media and entertainment, shoppers, technology, etc. |
| Gender: | Male (71.5%) |
| Location: | India (55.01%), USA (17.85%) |
Engagement
It’s really important to measure each piece of your content’s engagement as it will help you eliminate the elements or content type that’s showing below the average result.
For example, you probably don’t want to waste your effort creating content that people aren’t finding useful or even share-worthy.
Some of the basic KPIs that you should be checking on Google Analytics are:
- Bounce rate
- How many users are spending time on your site (Also consider traffic sources such as email, social media, etc.)
- Email open rate
- Social media likes and shares
- New visitors vs. return visitors
- pages/session
But there are a few other KPIs that people mostly ignore. Let’s talk about that part.
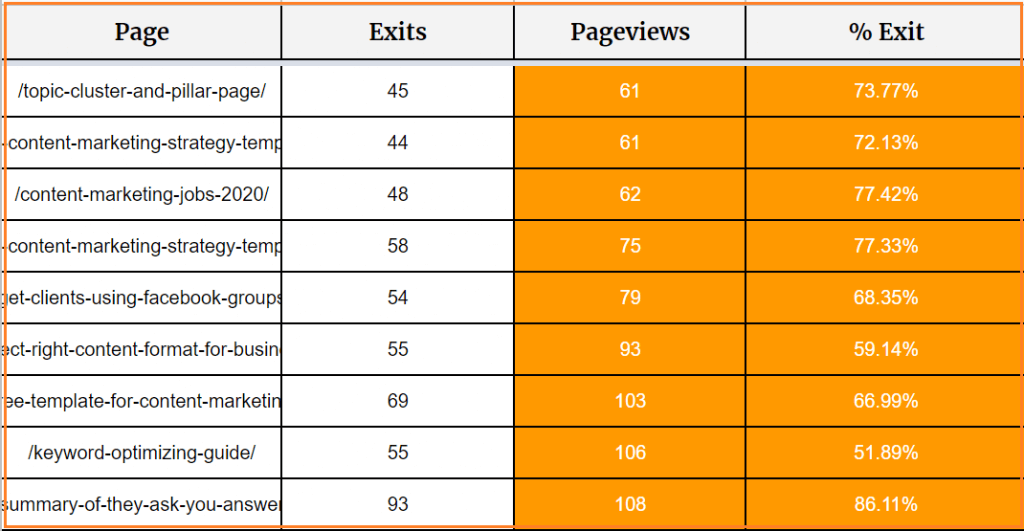
1. Exit rates (%)
Before showing you the exact steps to find out weak pages from your site, let’s understand some common acronyms.
Exits- This denotes the number of times when a user exited your site after visiting any specific page.
Exit rates (%) = (number of exits)/ (number of pageviews)
Keep in mind, high page views are great, but high exits aren’t (most of the cases). Again, pages with high page views and low exit indicate that users find the information they were looking for.
And, pages with low pageviews and high exits means the opposite.
Mostly, bounce rate and exit rates are quite similar. The only difference is in the case of bounce rate; the user only visits one page and exits from that same page. But in case of exit rates, the user visits at least more than one page of your site and then exits.
Now, let’s see how to find out the pages that need improvement to engage the users.
Step 1:
Follow the path in your Google Analytics dashboard: Behaviour → Site content → Exit pages.
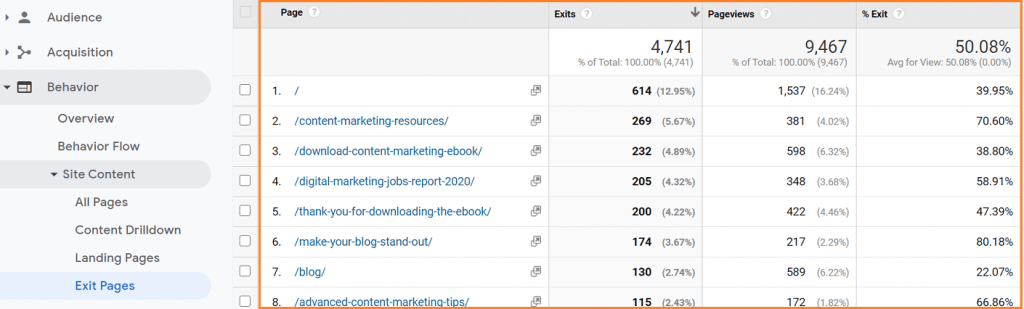
[Make sure you’ve extended the date range for at least 3-6 months to have enough data to measure. Also, increase the row numbers to get a list of all your site’s pages]
Also, note the average exit rates of your pages. In this case, it is 50.08%.
This average exit rate can be considered a benchmark where pages with above 50% of exit rates, will be scrutinized, and lower than 50% is good to go.
Step 2:
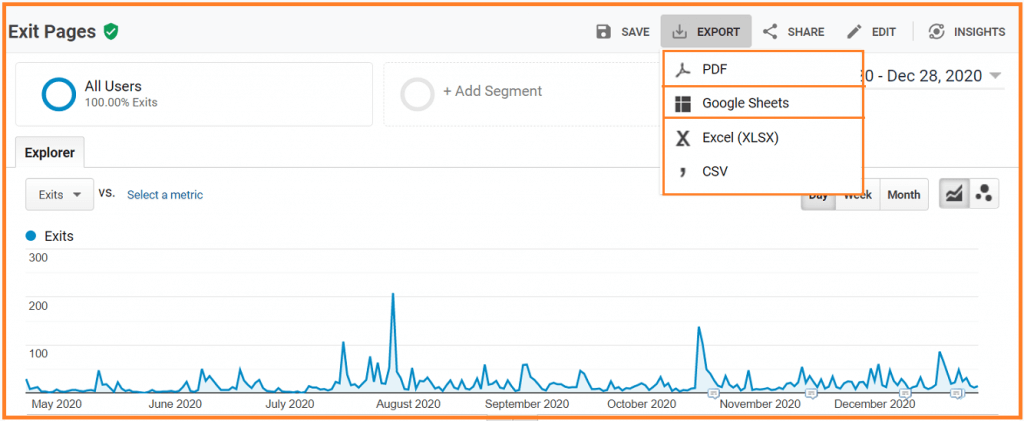
Export the data into Google sheet.
Step 3:
Sort the exit rates (%) column from largest to smallest.
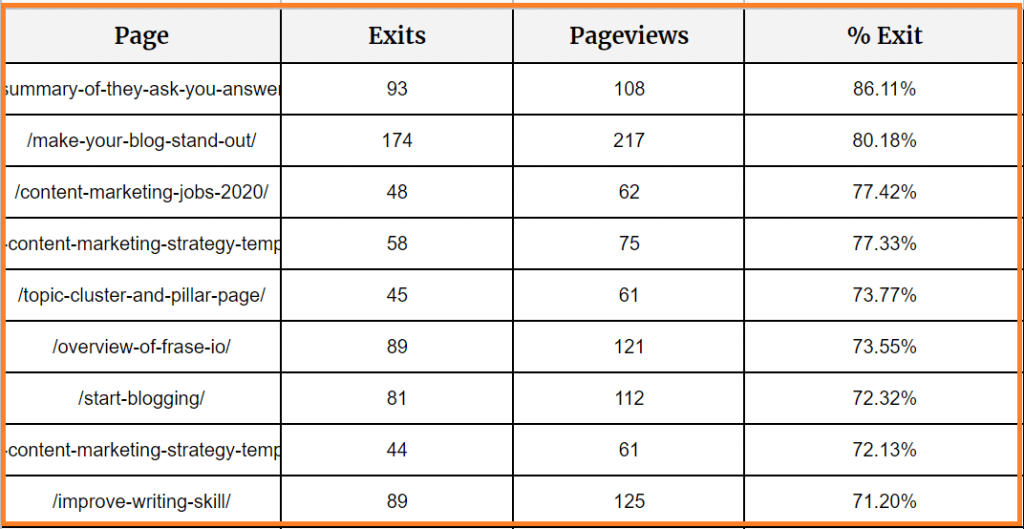
Since our average exit rate was 50%, we’ll delete all of the pages having exit rates lower than 50%.
That means these deleted pages are performing above the average.
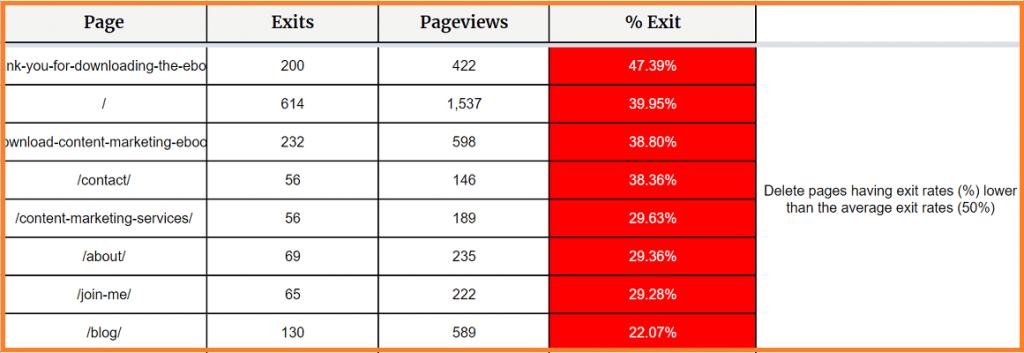
Step 4:
Now, you have pages that are getting above-average exit rates. In that way, you can clearly see pages that aren’t providing the information users are looking for.
Also, you can further narrow down the list by sorting the pageviews column from smallest to largest.
This will highlight the pages with high exit rates and low pageviews.
Anyway, I also learned this trick from the paper street (You may find it useful)
But, is always high exit rates bad in terms of user engagement?
No.
It’s always better to manually check the context of the pages that belong to these categories. There are certain types of pages that are always going to have low pageviews and high exit rates. The best example is the payment page that is usually considered the destination page for many com sites. The thank-you page is another example.
2. Navigation performance of your site
One of the important tasks of measuring engagement for your content is to analyze content navigation.
To measure the performance, follow this path in the GA dashboard: Behaviour → Site content → all pages → Navigation summary.
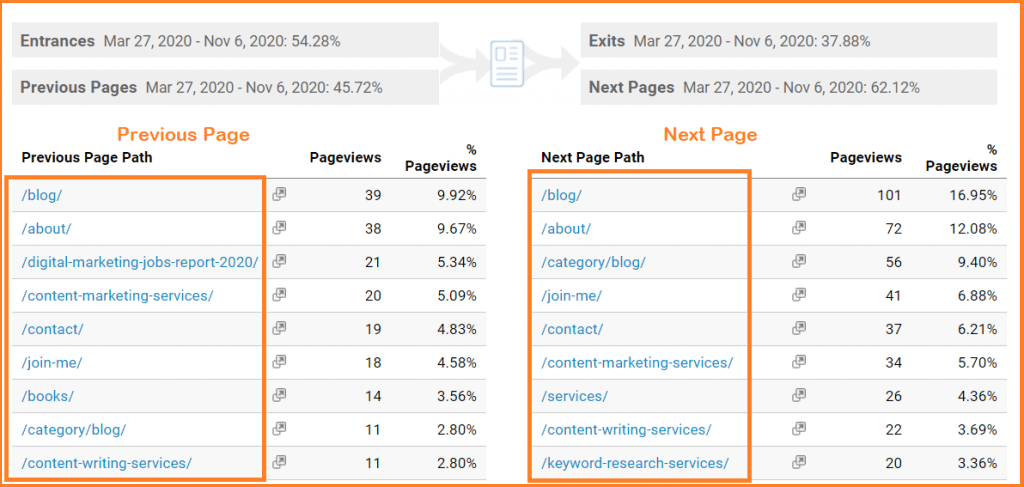
In that way, you’ll get to understand which navigation items are mostly used and ignored by the users.
Handpicked article: complete guide to building a subscription model for your business
Conversion
Almost every business is either looking to improve their site traffic or to improve their conversion to meet their goals. Obviously, driving more traffic is a good chance of getting more conversions. But what if you could’ve diagnosed every content piece to figure out the conversion rate of almost all pages.
In that way, you’ll get two major benefits:
- You can highlight successful content pieces (higher conversion rate) to modernize your content marketing strategy around these proven content.
- You’ll find a list of articles and landing pages (with below the average conversion rate) that need serious improvement.
To diagnose your entire content inventory with respect to conversion, you must take the help of Google analytics.
In google analytics, you can set conversion goals to track which pages are giving you more sales/email signups/form submission/etc.
I’m assuming you’ve already set Google analytic conversion goals for your business.
If not, then this video may help you in doing so.
Since measuring the process of goal conversion may vary depending on your business goal, I’ll try to share a broad view of tracking conversion.
Some of the metrics that you be looking for in GA:
- Which traffic sources are giving you a better conversion rate?
- Landing pages with the most and least conversion rate?
- Pages with a high conversion rate but low traffic
- Pages with low conversion rate but a high traffic
- Which part of your funnel has the highest percentage of user exits?
Let’s dive into one by one.
Traffic source vs. conversion rate
Path: Acquisition → All Traffic → Source/Medium → Comparison mode

Key takeaway:
Sources with an above-average conversion rate should be considered for your content distribution or promotion. Hence you can double down your effort to get traffic from these sources.
Landing pages vs. conversion rate
Path: Behaviour → Site content → Landing pages → Comparison mode
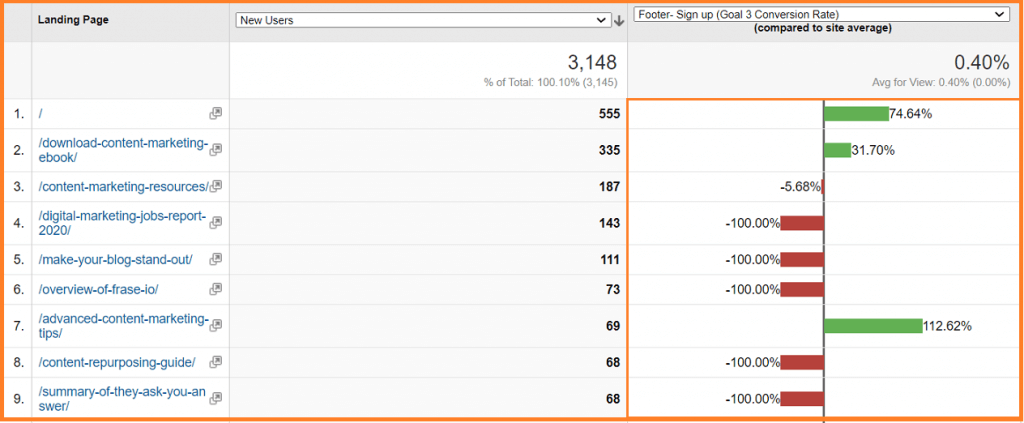
Key takeaway:
Ensure you manually check for the pages because not every page on your site is built initially to convert users.
So, measure data for the pages that were supposed to convert a user.
Also, by sorting the ‘new users column,’ you can track the pages with a low/high number of users with respect to conversion rate.
Funnel visualization
Path: Conversion → Goals → Funnel visualization
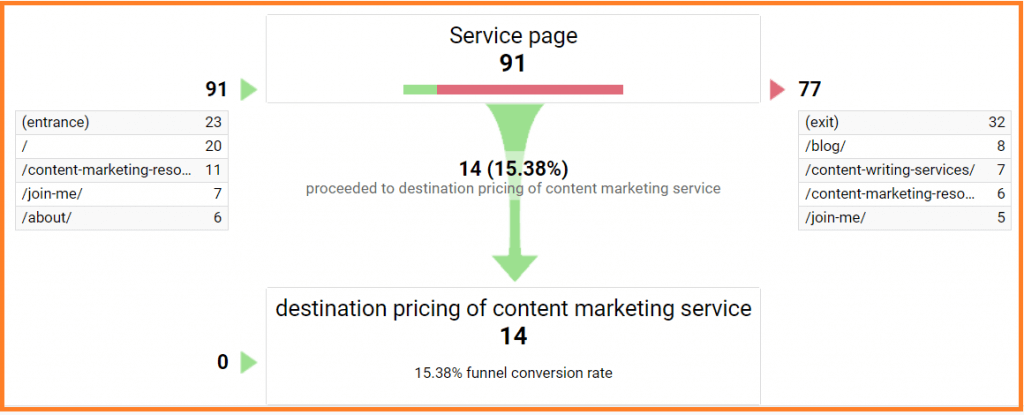
Funnel visualization is a powerful feature from GA that allows you to see users’ leakage before registering a successful conversion goal event.
Key takeaway:
The above image represents a two-step funnel visualization. But if you have an ecom site or want your users to follow a certain path on your site, make sure you add each of the steps within the goal conversion.
That will help you to visualize the performance of each page of your funnel.
[Note: Common examples of conversion are newsletter signup, product sale, contact form submission, request a quote submission, etc.]
3. Buyer’s stage
Almost every buyer goes through several stages, from getting to know about any specific problem or brand to purchasing.
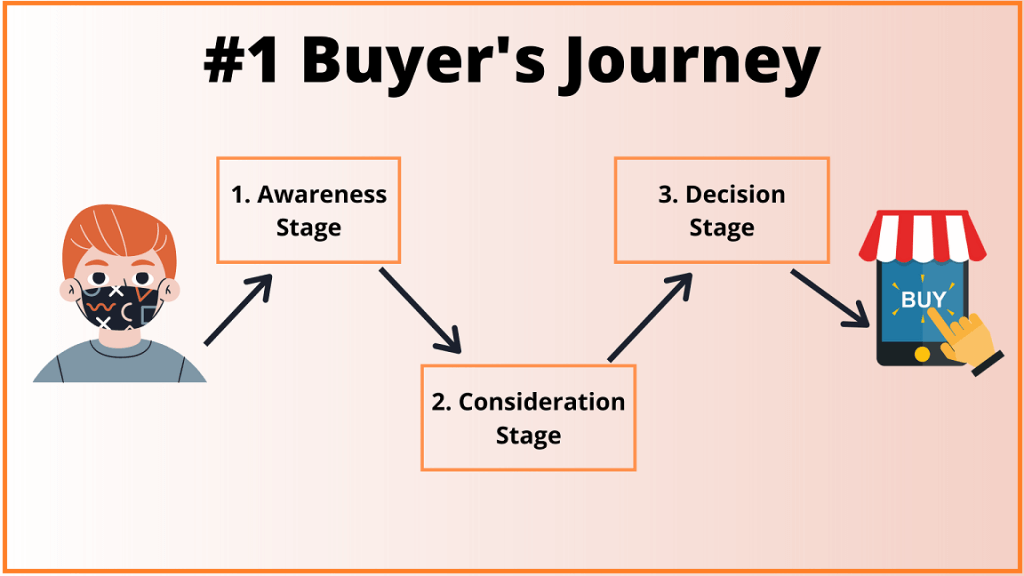
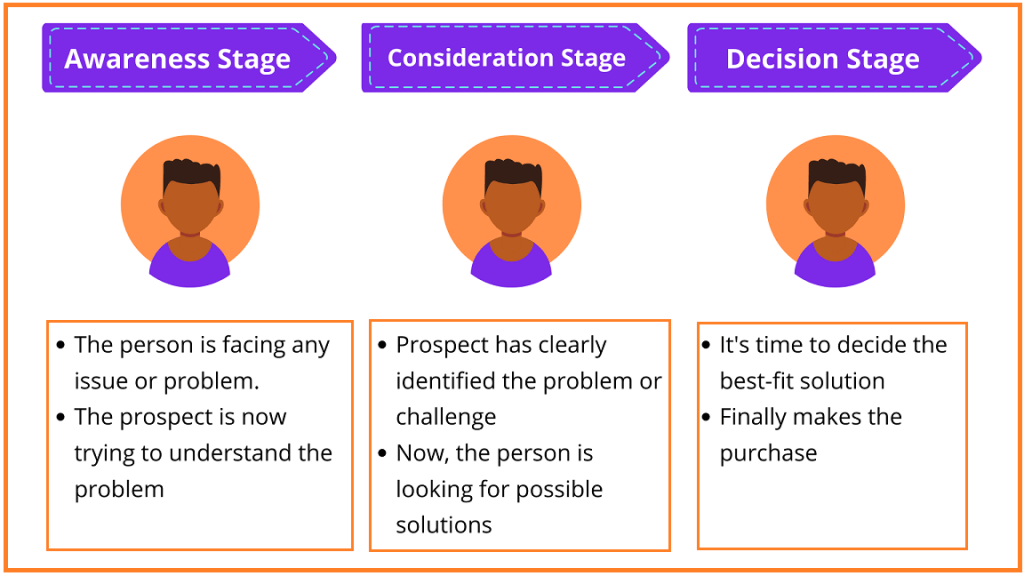
Usually, the buyers’ stage consists of:
- Awareness stage ( in this phase, the user isn’t aware of the problem/product/brand. So he/she will try to gather more information about it.)
- Consideration stage (Now, the user is trying to determine the possible solution for the problem)
- Action stage (where the user finally makes the purchase or take a desired action)
Here’s an example:
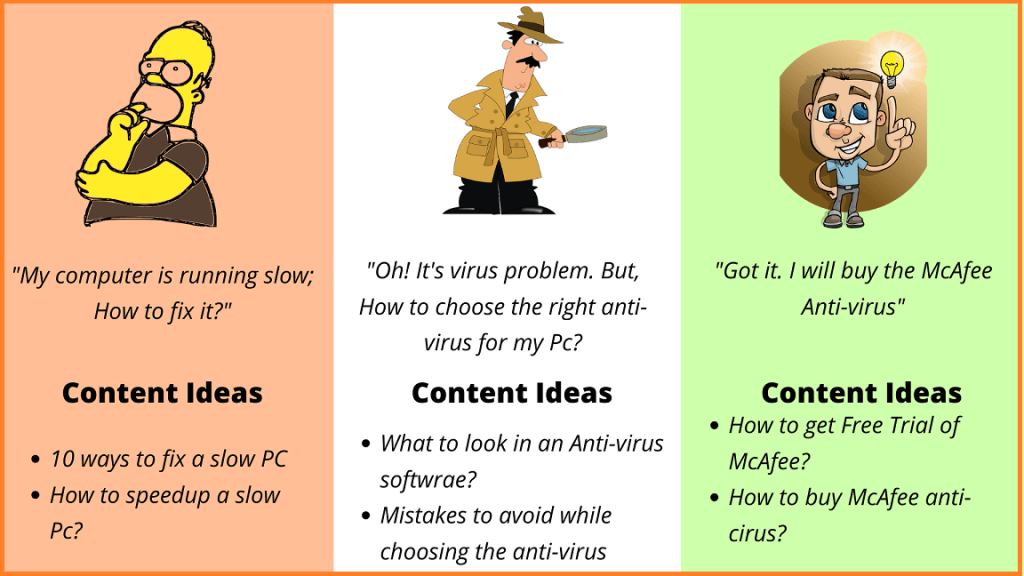
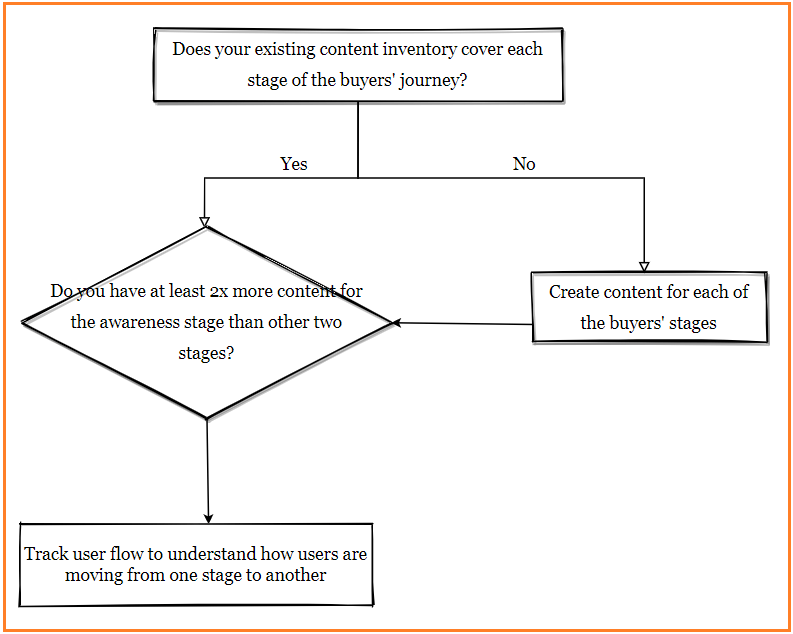
Therefore every content marketing program should focus on helping users from each of the phases. That also means you should’ve enough content to encourage users to go from one stage to the next.
Now, while performing your content audit, you need to check whether your existing content inventory has covered each of these buyers’ stages or not.
The best way to track this is by managing an excel sheet where you can categorize all of your pages into three different categories: Awareness, Consideration, and action/decision.
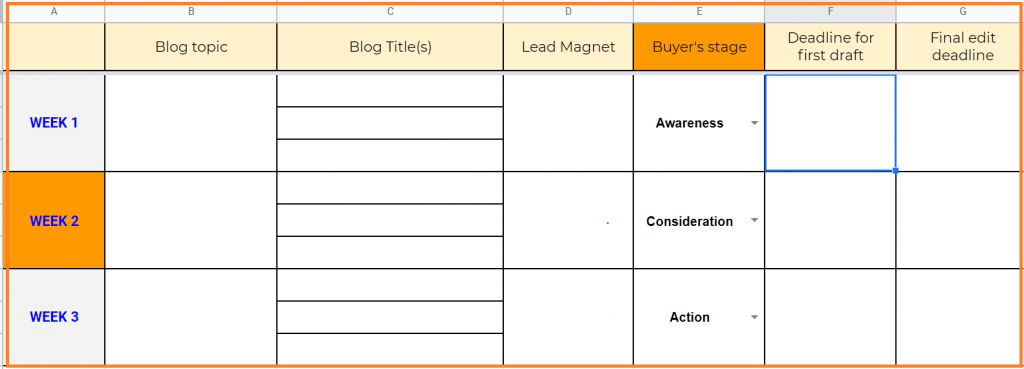
Download this content marketing template for free to stay organized.
Now, the most important thing to consider: while checking your content inventory, make sure that you have at least 2x more content for awareness stages than the other two.
The reason is simple. No matter how great your funnel’s conversion rate is, if you can increase traffic to the top of the funnel, then the conversion number will eventually increase.
And to attract more users to the top of the funnel, you need more content in the awareness stage.
Actions to do:
Final words
When it comes to auditing your site’s content, you have so much information and choices to play with. But it is always recommended that you also look for other channels such as podcasts, YouTube videos, etc.
Before you start looking back at your content marketing, always consider the business goal before diving into any technical audit.
Otherwise, you’ll run behind the metrics that don’t add direct value to your business.
Now, it’s your time to take action, to modernize your content strategy backed with data.
Let me know if you find any questions, help, or even suggestions; I would really love to assist you.
To keep in touch with me, join me.

Sk Rafiqul Islam is a content marketing practitioner with 3+ years of practical experience. He spends most of his time helping businesses to build a loyal audience with content marketing. He is also running a tech career blog called 10Pie and content marketing VIP, a bi-weekly marketing newsletter. In his free time, he loves reading books and playing football.